Artificial data
set.seed(99999)
mydata = data.frame(x = rep(1:5, times = 2), y = rnorm(10, 10), z = rep(c("a",
"b"), each = 5))
mydata
x      y z
1  1  9.574 a
2  2  9.717 a
3  3  9.101 a
4  4 10.707 a
5  5 12.092 a
6  1 11.636 b
7  2  9.460 b
8  3  9.396 b
9  4  9.797 b
10 5  9.688 b
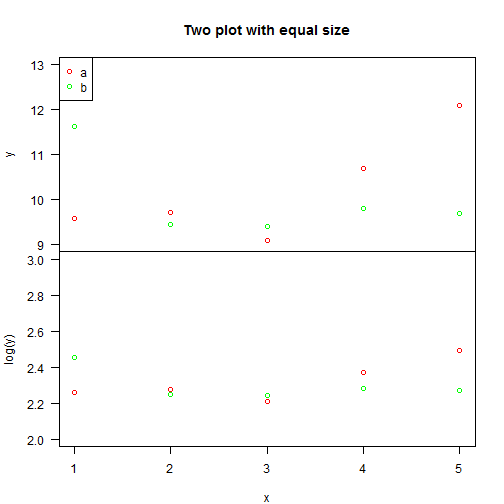
Plot
Same x axis but different y axis.
par(mfrow = c(2, 1), mar = c(0, 4.1, 4, 2))
# mfrow: A vector of the form c(nr, nc). Subsequent figures will be drawn in
# an nr-by-nc array on the device by rows

# mar: A numerical vector of the form c(bottom, left, top, right) which
# gives the number of lines of margin to be specified on the four sides of
# the plot.  The default is c(5, 4, 4, 2) + 0.1.

# first plot
plot(y ~ x, data = mydata, axes = FALSE, frame.plot = TRUE, xlab = "", main = "Two plot with equal size",
col = c("red", "green")[mydata$z], ylim = c(9, 13))
# The option axes=FALSE suppresses both x and y axes.  xaxt='n' and yaxt='n'
# suppress the x and y axis respectively.

# frame.plot: a logical indicating whether a box should be drawn around the
# plot.

# add legend
legend(x = "topleft", legend = c("a", "b"), col = c("red", "green"), pch = 1)

# add y axis
axis(side = 2, las = 1)
# side: an integer indicating the side of the graph to draw the axis
# (1=bottom, 2=left, 3=top, 4=right)

# las: numeric in {0,1,2,3}; the style of axis labels.  0: always parallel
# to the axis [default], 1: always horizontal, 2: always perpendicular to
# the axis, 3: always vertical.

# second plot
par(mar = c(4, 4.1, 0, 2))

plot(log(y) ~ x, data = mydata, axes = FALSE, frame.plot = TRUE, xlab = "x",
ylab = "log(y)", col = c("red", "green")[mydata$z], ylim = c(2, 3))

# add y axis
axis(side = 2, las = 1)

# add x axis
axis(side = 1)