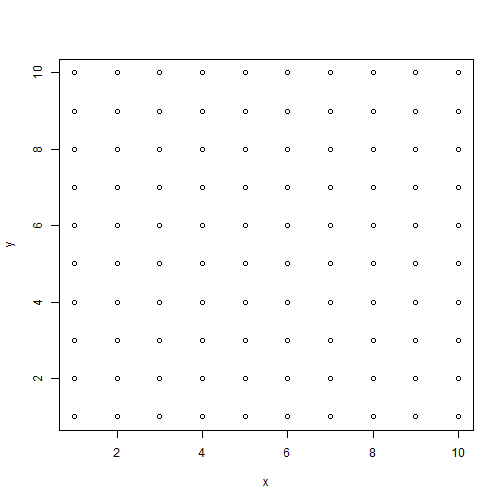
set.seed(999)
x=sample(1:10,1000,replace=TRUE)
y=sample(1:10,1000,replace=TRUE)
plot(x,y)
f=as.data.frame(table(x,y))
f$x=as.numeric(as.vector(f$x))
f$y=as.numeric(as.vector(f$y))
f$Freq=as.numeric(as.vector(f$Freq))
plot(f$x,f$y,cex=2*f$Freq/mean(f$Freq))
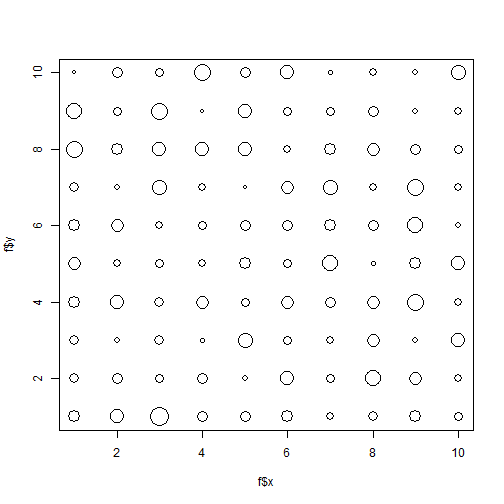
cex can be other values related to f$Freq. I divided it by its mean,
so the size of points will not too big.