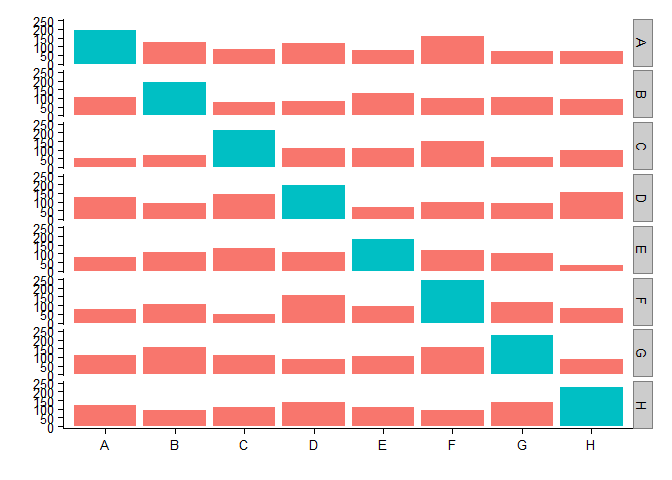
id <- c("A","B","C","D","E","F","G","H")
df =data.frame(id1=rep(id,each=8),id2=rep(id,8),comm=rep(0,64),class=rep(0,64))
n=1
for(i in 1:length(id)){
for(j in 1:length(id)){
if(i==j){
df$comm[n]=as.integer(rnorm(1,200,30))
df$class[n]=1
}else{

df$comm[n]=as.integer(rnorm(1,100,30))
}
n=n+1
}
}
library(ggplot2)
ggplot(df, aes(x=factor(id2),y=comm,fill=factor(class)))+
geom_bar(stat="identity")+
facet_grid(id1 ~ .)+
theme_bw() +
theme(panel.border = element_blank(),
panel.grid.major = element_blank(),
panel.grid.minor = element_blank(),
axis.line = element_line(colour = "black"),
legend.title = element_blank(),
legend.position="none")+
labs(x="",y="")