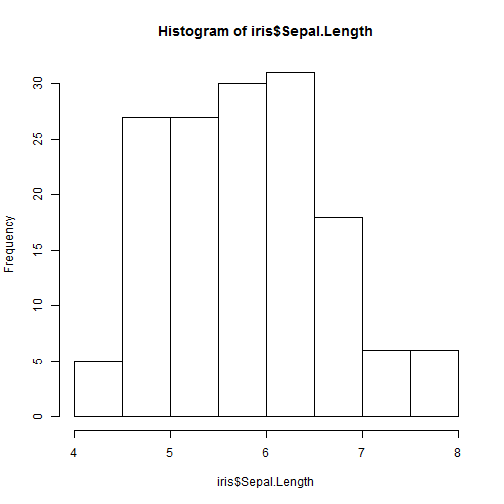
Defaut plot
head(iris)
Sepal.Length Sepal.Width Petal.Length Petal.Width Species
1          5.1         3.5          1.4         0.2  setosa
2          4.9         3.0          1.4         0.2  setosa
3          4.7         3.2          1.3         0.2  setosa
4          4.6         3.1          1.5         0.2  setosa
5          5.0         3.6          1.4         0.2  setosa
6          5.4         3.9          1.7         0.4  setosa
hist(iris$Sepal.Length)

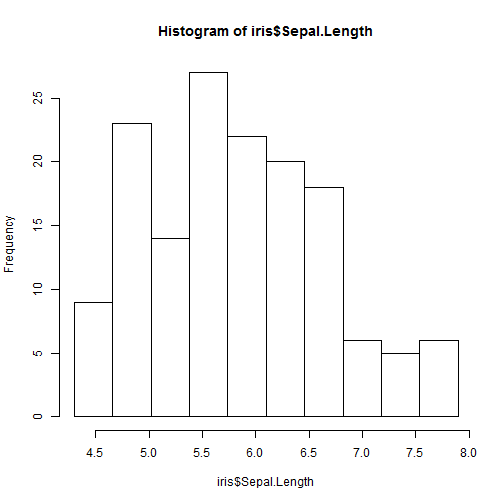
Set the number of bins
## length.out = number of bins + 1 set the number of bins to 10
hist(iris$Sepal.Length, breaks = seq(min(iris$Sepal.Length), max(iris$Sepal.Length),
length.out = 11))
