set.seed(999)
dat<-rnorm(n=1000, m=24, sd=5)
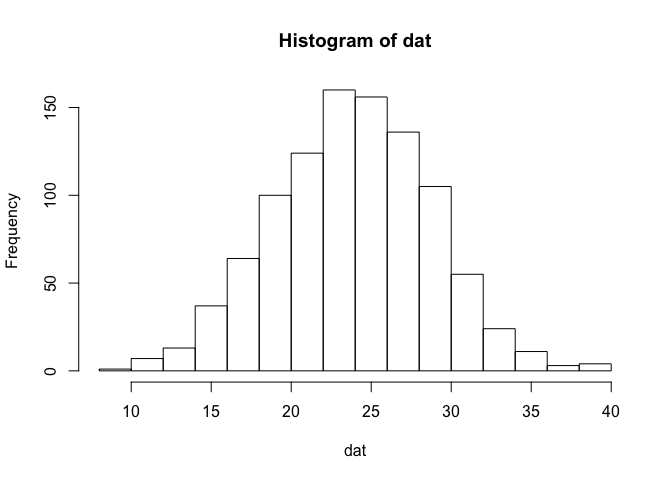
histInfor <- hist(dat)
histInfor
$breaks
 [1]  8 10 12 14 16 18 20 22 24 26 28 30 32 34 36 38 40

$counts
 [1]   1   7  13  37  64 100 124 160 156 136 105  55  24  11   3   4

$density
 [1] 0.0005 0.0035 0.0065 0.0185 0.0320 0.0500 0.0620 0.0800 0.0780 0.0680
[11] 0.0525 0.0275 0.0120 0.0055 0.0015 0.0020

$mids
 [1]  9 11 13 15 17 19 21 23 25 27 29 31 33 35 37 39

$xname
[1] "dat"

$equidist
[1] TRUE

attr(,"class")
[1] "histogram"
Number of bins (=10)
The bins don’t correspond to exactly the number you put in, because of the way R runs its algorithm to break up the data but it gives you generally what you want.
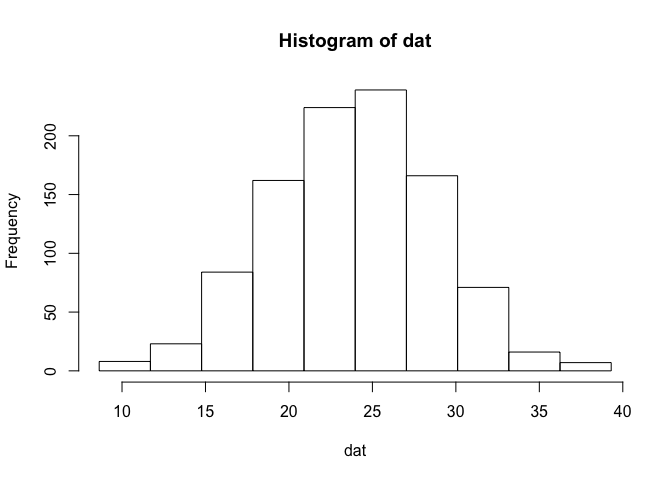
hist(dat, breaks = 10)
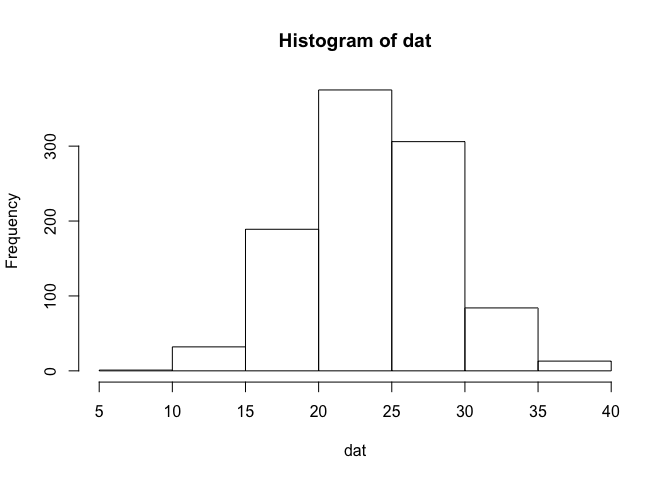
Exact number of bins (=10)
hist(dat, breaks = seq(min(dat), max(dat), length.out = 11))
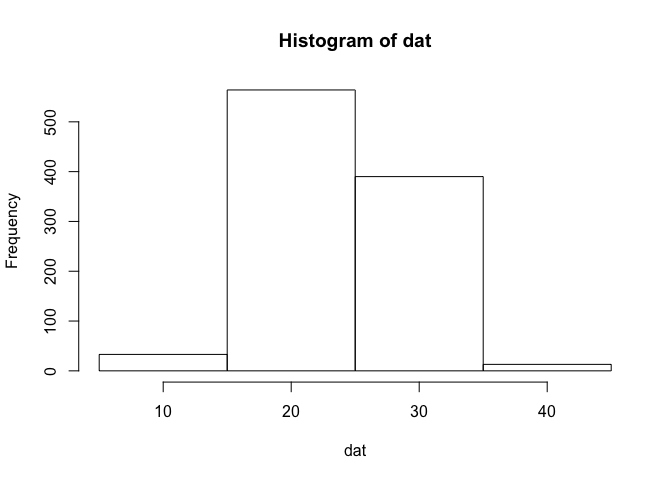
width of bin (=10)
summary(dat)
   Min. 1st Qu.  Median    Mean 3rd Qu.    Max.
  8.633  20.470  23.950  23.840  27.180  39.310
hist(dat, breaks = seq(from=5, to=45, by=10))