library(scholar)
library(ggplot2)
cit <- get_citation_history('8fX1TSQAAAAJ')
# '8fX1TSQAAAAJ' is my google scholar id
ggplot(cit,aes(x=year,y=cites)) +
  geom_bar(stat='identity') +
  theme_bw() +
  xlab('Year') +
  ylab('Google Scholar Citations') +
  annotate('text',
           label=format(Sys.time(), "%Y-%m-%d %H:%M:%S %Z"),
           x=-Inf, y=Inf,
           vjust=1.5, hjust=-0.05,
           size=3,colour='gray') +
  geom_text(aes(label=cites), vjust=1.5, color="white", size=3) +
  scale_y_continuous(limits = c(0, 60)) +
  scale_x_continuous(breaks=2011:2016) +
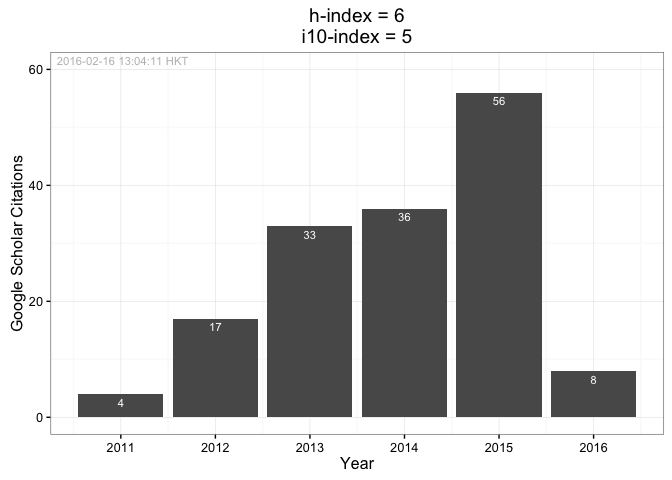
  ggtitle("h-index = 6\ni10-index = 5")

