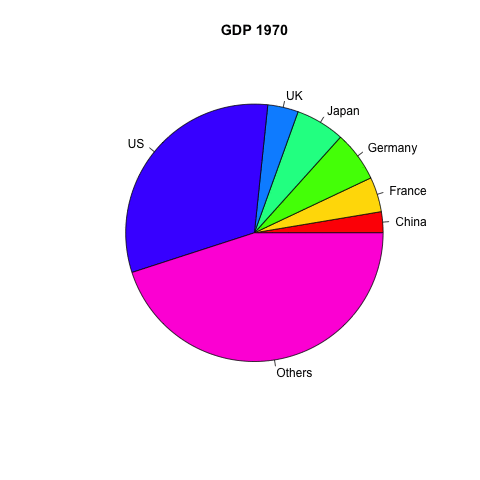
1. Simple Pie Chart
GDP data was downloaded from here.
setwd("/Users/alicefelix/Desktop/gdp")
dat <- read.table("GDP1970_2014.txt",header = TRUE)
for(i in 1970:2014){
  fn <- paste(i,".png",sep="")
  df <- subset(dat,Year==i)
  otherGDP <- 2 * df[df$Country=="World",]$GDP - sum(df$GDP)
  df2 <- rbind(df,data.frame(Country="Others",Currency="US$", Year=i, GDP=otherGDP))
  df3 <- subset(df2, Country != "World")
  png(fn)
  pie(df3$GDP, labels = df3$Country, main=paste("GDP",i,sep=" "), col=rainbow(length(df3$Country)))
  dev.off()
}
system("convert -delay 50 -loop 0 $(ls -v *png) gdp1970_2014.gif")
system("rm *png")
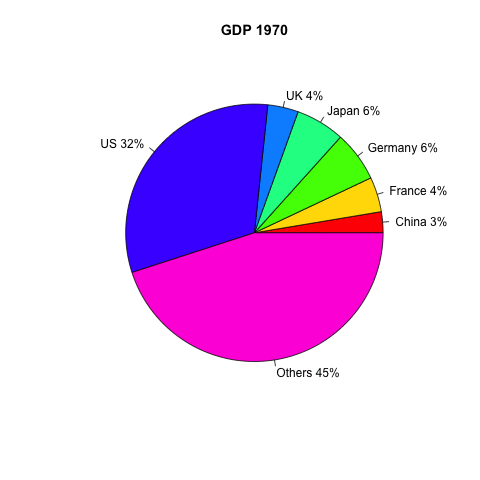
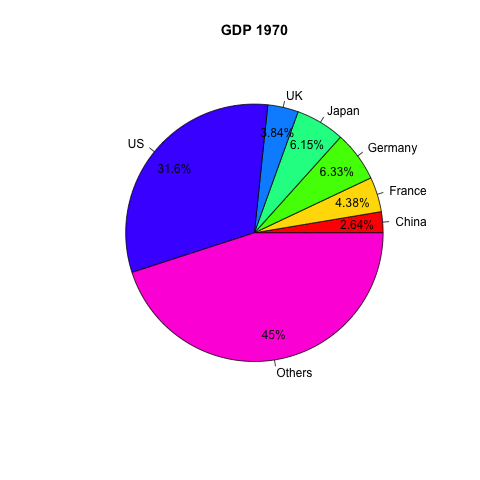
2. Pie Chart with Annotated Percentages
for(i in 1970:2014){
  fn <- paste(i,".png",sep="")
  df <- subset(dat,Year==i)
  otherGDP <- 2 * df[df$Country=="World",]$GDP - sum(df$GDP)
  df2 <- rbind(df,data.frame(Country="Others",Currency="US$", Year=i, GDP=otherGDP))
  df3 <- subset(df2, Country != "World")
  pct <- round(df3$GDP/sum(df3$GDP)*100)
  pct <- paste(pct,"%", sep="")
  lbls <- paste(df3$Country, pct, sep=" ")
  png(fn)
  pie(df3$GDP, labels = lbls, main=paste("GDP",i,sep=" "), col=rainbow(length(df3$Country)))
  dev.off()
}
system("convert -delay 50 -loop 0 $(ls -v *png) gdp1970_2014v2.gif")
system("rm *png")
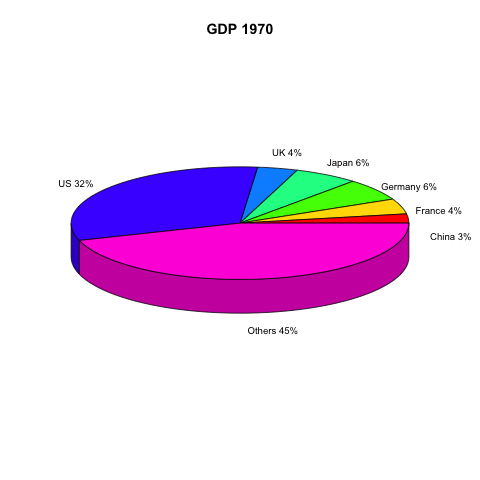
3. 3D Pie Chart
library(plotrix)
for(i in 1970:2014){
  fn <- paste(i,".png",sep="")
  df <- subset(dat,Year==i)
  otherGDP <- 2 * df[df$Country=="World",]$GDP - sum(df$GDP)
  df2 <- rbind(df,data.frame(Country="Others",Currency="US$", Year=i, GDP=otherGDP))
  df3 <- subset(df2, Country != "World")
  pct <- round(df3$GDP/sum(df3$GDP)*100)
  pct <- paste(pct,"%", sep="")
  lbls <- paste(df3$Country, pct, sep=" ")
  png(fn)
  pie3D(df3$GDP, labels = lbls, main=paste("GDP",i,sep=" "), col=rainbow(length(df3$Country)), labelcex = 0.8)
  dev.off()
}
system("convert -delay 50 -loop 0 $(ls -v *png) gdp1970_2014v3.gif")
system("rm *png")
4. Pie Chart with Annotated Percentages
code from 糗世界.
pie1 <- function (x, labels = names(x), edges = 200, radius = 0.8, clockwise = FALSE,
                  init.angle = if (clockwise) 90 else 0, density = NULL, angle = 45,
                  col = NULL, border = NULL, lty = NULL, main = NULL, percentage=T,
                  rawNumber=F, digits=3, cutoff=0.01, legend=F, legendpos="topright",
                  legendcol=2, ...)
{
    if (!is.numeric(x) || any(is.na(x) | x < 0)){
      stop("'x' values must be positive.")
    }

    if (is.null(labels)){
      labels <- as.character(seq_along(x))
    }else{
      labels <- as.graphicsAnnot(labels)
    }

    rawX <- x
    x <- c(0, cumsum(x)/sum(x))
    dx <- diff(x)
    nx <- length(dx)
    plot.new()
    pin <- par("pin")
    xlim <- ylim <- c(-1, 1)

    if (pin[1L] > pin[2L]){
      xlim <- (pin[1L]/pin[2L]) * xlim
    }else{
      ylim <- (pin[2L]/pin[1L]) * ylim
    }

    dev.hold()
    on.exit(dev.flush())
    plot.window(xlim, ylim, "", asp = 1)

    if (is.null(col)){
      col <- if (is.null(density)){
        c("white", "lightblue", "mistyrose", "lightcyan",
                "lavender", "cornsilk", "pink")
      }else{
        par("fg")
      }
    }

    if (!is.null(col)){
      col <- rep_len(col, nx)
    }

    if (!is.null(border)){
      border <- rep_len(border, nx)
    }

    if (!is.null(lty))
        lty <- rep_len(lty, nx)
    angle <- rep(angle, nx)
    if (!is.null(density))
        density <- rep_len(density, nx)
    twopi <- if (clockwise)
        -2 * pi
    else 2 * pi
    t2xy <- function(t) {
        t2p <- twopi * t + init.angle * pi/180
        list(x = radius * cos(t2p), y = radius * sin(t2p))
    }
    for (i in 1L:nx) {
        n <- max(2, floor(edges * dx[i]))
        P <- t2xy(seq.int(x[i], x[i + 1], length.out = n))
        polygon(c(P$x, 0), c(P$y, 0), density = density[i], angle = angle[i],
            border = border[i], col = col[i], lty = lty[i])
        if(!legend){
        	P <- t2xy(mean(x[i + 0:1]))
	        lab <- as.character(labels[i])
	        if (!is.na(lab) && nzchar(lab)) {
	            lines(c(1, 1.05) * P$x, c(1, 1.05) * P$y)
	            text(1.1 * P$x, 1.1 * P$y, labels[i], xpd = TRUE,
	                adj = ifelse(P$x < 0, 1, 0), ...)
	        }
        }
    }
    if (percentage) {
    	for (i in 1L:nx){
    		if(dx[i]>cutoff){
    			P <- t2xy(mean(x[i + 0:1]))
            	text(.8 * P$x, .8 * P$y, paste(formatC(dx[i]*100, digits=digits), "%", sep=""), xpd = TRUE,
                	adj = .5, ...)
    		}
        }
    }else{
        if(rawNumber){
		for (i in 1L:nx){
    			if(dx[i]>cutoff){
    				P <- t2xy(mean(x[i + 0:1]))
            		text(.8 * P$x, .8 * P$y, rawX[i], xpd = TRUE,
                		adj = .5, ...)
    			}
        	}
        }
    }
    if(legend) legend(legendpos, legend=labels, fill=col, border="black", bty="n", ncol = legendcol)
    title(main = main, ...)
    invisible(NULL)
}
for(i in 1970:2014){
  fn <- paste(i,".png",sep="")
  df <- subset(dat,Year==i)
  otherGDP <- 2 * df[df$Country=="World",]$GDP - sum(df$GDP)
  df2 <- rbind(df,data.frame(Country="Others",Currency="US$", Year=i, GDP=otherGDP))
  df3 <- subset(df2, Country != "World")
  png(fn)
  pie1(df3$GDP, labels = df3$Country, main=paste("GDP",i,sep=" "), col=rainbow(length(df3$Country)))
  dev.off()
}
system("convert -delay 50 -loop 0 $(ls -v *png) gdp1970_2014v4.gif")
system("rm *png")
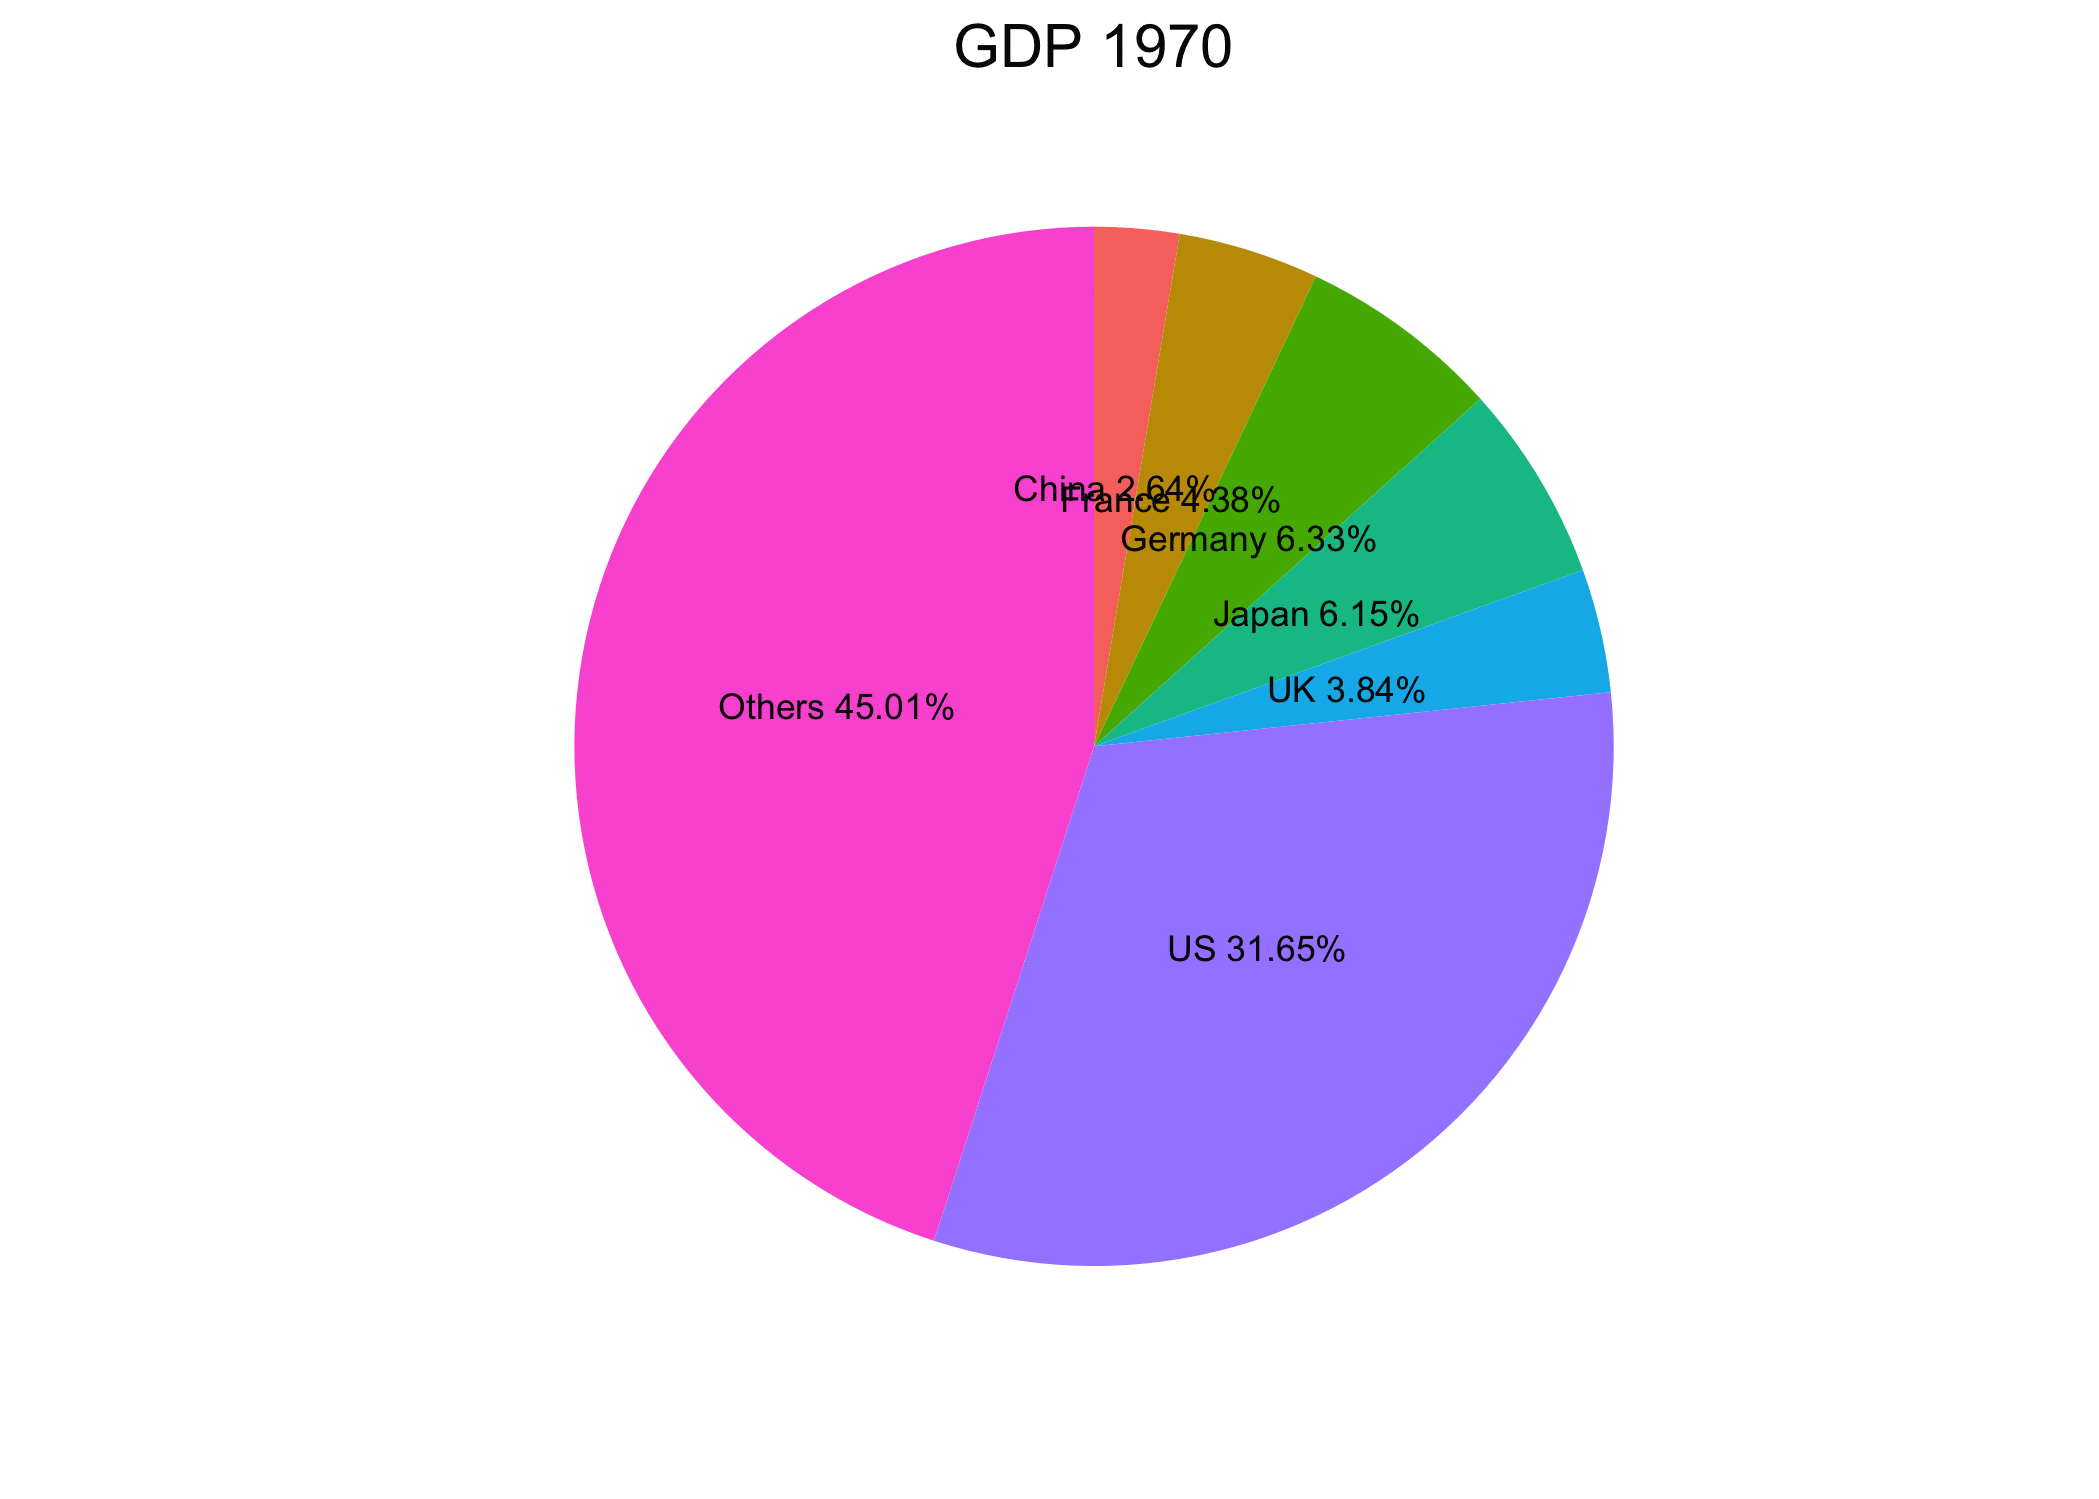
5. pie chart with ggplot2
library(ggplot2)
library(dplyr)

for(i in 1970:2014){
  fn <- paste(i,".png",sep="")
  df <- subset(dat,Year==i)
  otherGDP <- 2 * df[df$Country=="World",]$GDP - sum(df$GDP)
  df2 <- rbind(df,data.frame(Country="Others",Currency="US$", Year=i, GDP=otherGDP))
  df3 <- subset(df2, Country != "World")
  #df3 = df3[order(df3$GDP, decreasing = TRUE),] #用 order() 让数据框的数据按 GDP 列数据从大到小排序
  df3 <- df3 %>% group_by(Year) %>% mutate(pos = cumsum(GDP)- GDP/2)

  pct <- round(df3$GDP/sum(df3$GDP)*100, 2)
  pct <- paste(pct,"%", sep="")
  lbls <- paste(df3$Country, pct, sep=" ")

  p <- ggplot(df3, aes(x = "", y = GDP, fill = Country)) +
    geom_bar(stat = "identity", width = 1) +
    coord_polar(theta = "y") +
    labs(x = "", y = "", title = paste("GDP", i)) +   ## 将标签设为空
    geom_text(aes(x="", y=pos, label = lbls), size=3) +
    theme_bw() +
    theme(panel.border = element_blank(), panel.grid.major = element_blank(),
          panel.grid.minor = element_blank(), axis.line = element_blank(),
          axis.ticks = element_blank(), axis.text.x = element_blank(),
          legend.position ="none") # 去掉背景坐标图标
  ggsave(fn,p)
}
system("convert -delay 50 -loop 0 $(ls -v *png) gdp1970_2014v5.gif")
system("rm *png")