library(ggplot2)
dat <- data.frame(x=rnorm(10000), y=rnorm(10000))
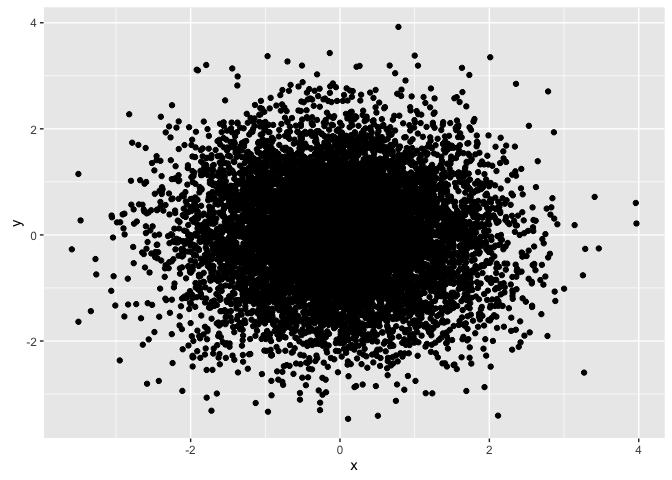
point plot
ggplot(dat, aes(x=x, y=y)) + geom_point()

jittering
ggplot(dat, aes(x=x, y=y)) + geom_point(position = 'jitter')
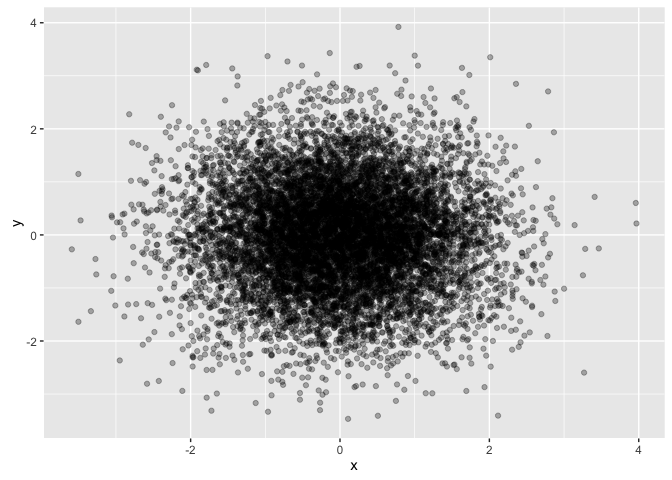
alpha
ggplot(dat, aes(x=x, y=y)) + geom_point(alpha = 0.3)
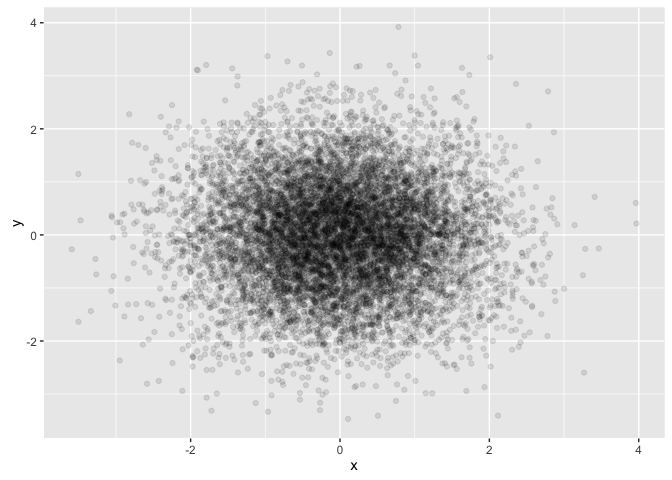
ggplot(dat, aes(x=x, y=y)) + geom_point(alpha = 0.1)
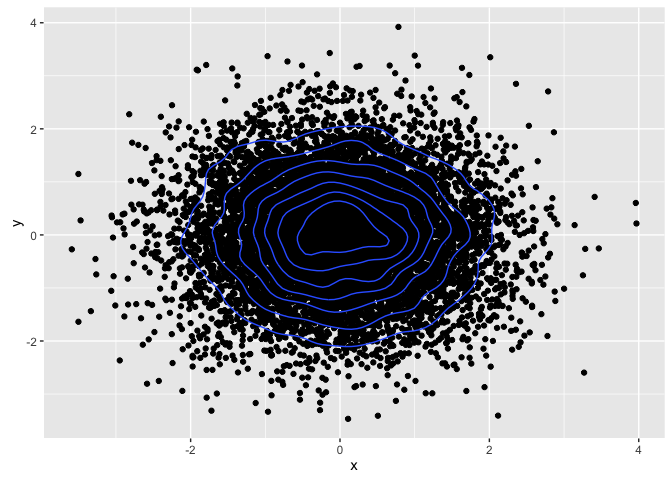
contour lines
ggplot(dat, aes(x=x, y=y)) + geom_point() + geom_density2d()
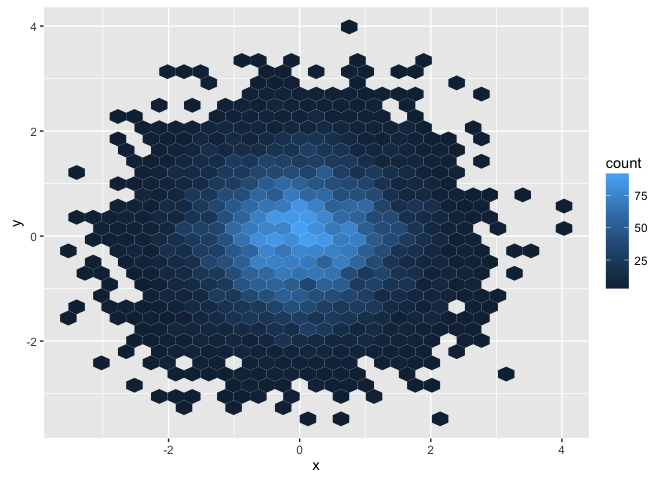
HexBins
ggplot(dat, aes(x=x, y=y)) + stat_binhex()
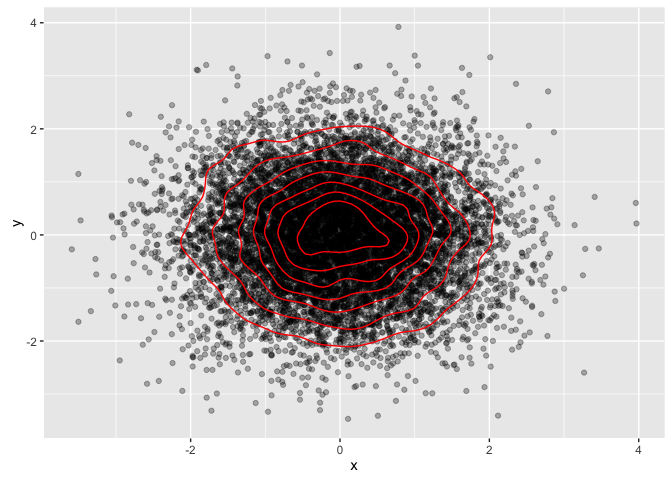
combined
ggplot(dat, aes(x=x, y=y)) + geom_point(colour='black',alpha=0.3) + geom_density2d(colour='red')