Boxplots With Point Identification
library(car)
head(Prestige)
education income women prestige census type
gov.administrators      13.11  12351 11.16     68.8   1113 prof
general.managers        12.26  25879  4.02     69.1   1130 prof
accountants             12.77   9271 15.70     63.4   1171 prof
purchasing.officers     11.42   8865  9.11     56.8   1175 prof
chemists                14.62   8403 11.68     73.5   2111 prof
physicists              15.64  11030  5.13     77.6   2113 prof
# if not specified, Boxplot will use the row names of the data argument
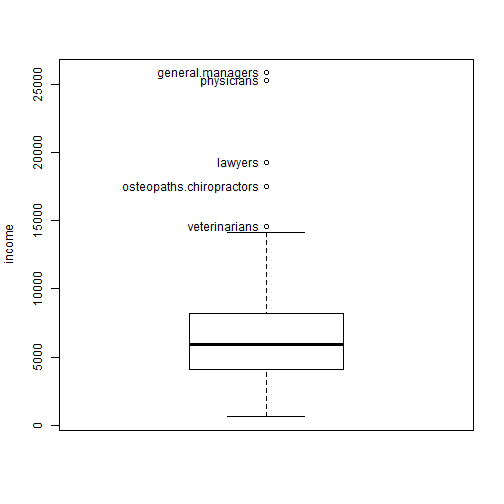
# identify all outliers: id.n=Inf
Boxplot(~income, data = Prestige, id.n = Inf)

[1] "general.managers"         "lawyers"
[3] "physicians"               "veterinarians"
[5] "osteopaths.chiropractors"
# default id.n=10
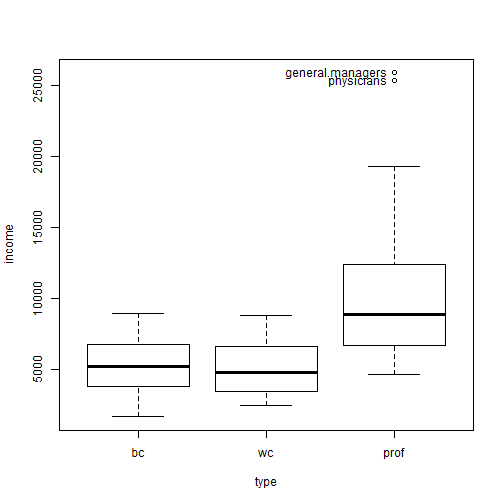
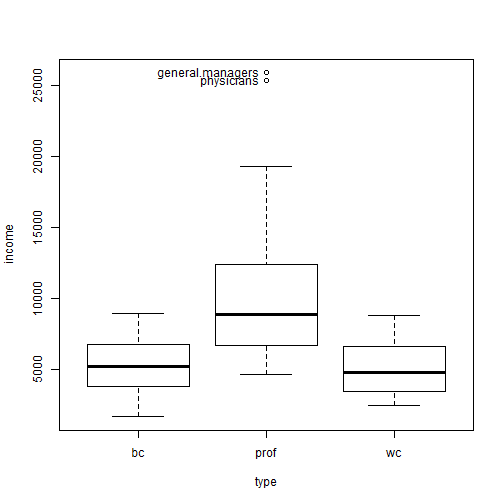
Boxplot(income ~ type, data = Prestige)

[1] "general.managers" "physicians"
# change plot order
Boxplot(income ~ type, data = Prestige, at = c(1, 3, 2))
[1] "general.managers" "physicians"
head(Mroz)
lfp k5 k618 age  wc hc     lwg    inc
1 yes  1    0  32  no no 1.21016 10.910
2 yes  0    2  30  no no 0.32850 19.500
3 yes  1    3  35  no no 1.51413 12.040
4 yes  0    3  34  no no 0.09212  6.800
5 yes  1    2  31 yes no 1.52428 20.100
6 yes  0    0  54  no no 1.55649  9.859
# produce parallel boxplots for k5+k618 within levels of the grouping
# variable ('lfp' and 'wc')
x = Boxplot(k5 + k618 ~ lfp * wc, data = Mroz)
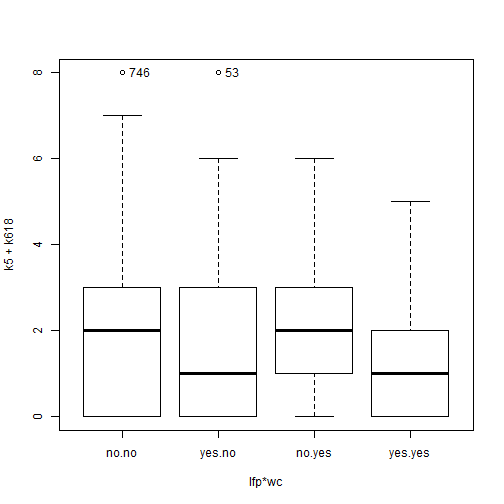
# double check point labels:
temp = Mroz[Mroz$lfp == "no" & Mroz$wc == "no", ]
pattern <- (temp$k5 + temp$k618) == 8
rownames(temp)[which(pattern)]
[1] "746"
temp2 = Mroz[Mroz$lfp == "yes" & Mroz$wc == "no", ]
pattern2 <- (temp2$k5 + temp2$k618) == 8
rownames(temp2)[which(pattern2)]
[1] "53"
# specify the points lables
with(Prestige, Boxplot(income, labels = rownames(Prestige)))
[1] "general.managers"         "lawyers"
[3] "physicians"               "veterinarians"
[5] "osteopaths.chiropractors"
# plot 'income' within levels of the grouping variable 'type'
with(Prestige, Boxplot(income, type, labels = rownames(Prestige)))
[1] "general.managers" "physicians"
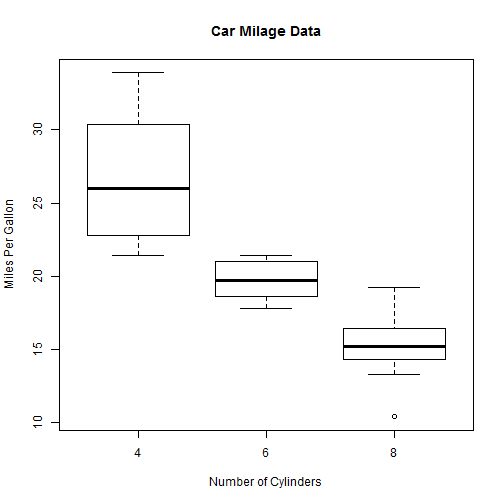
Basic boxplot
Add varwidth=TRUE to make boxplot widths proportional to the square root of the samples sizes. Add horizontal=TRUE to reverse the axis orientation.
boxplot(mpg ~ cyl, data = mtcars, main = "Car Milage Data", xlab = "Number of Cylinders",
ylab = "Miles Per Gallon")
Notched Boxplot
Notched Boxplot of Tooth Growth Against 2 Crossed Factors.
- boxes colored for ease of interpretation.
boxplot(len ~ supp * dose, data = ToothGrowth, notch = TRUE, col = (c("gold",
"darkgreen")), main = "Tooth Growth", xlab = "Suppliment and Dose")
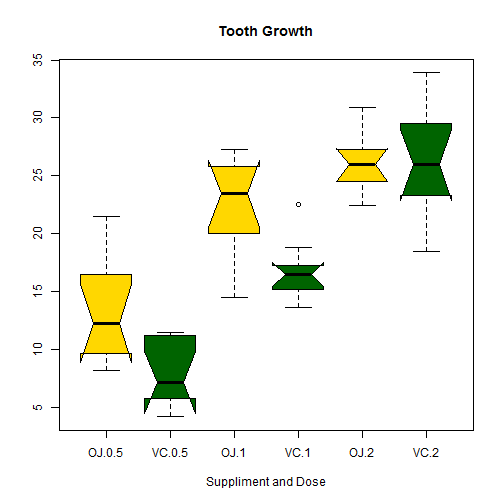
In the notched boxplot, if two boxes' notches do not overlap this is ‘strong evidence’ their
medians differ (Chambers et al., 1983, p. 62).
- Colors recycle.
In the example above, if I had listed 6 colors, each box would have its own color.
Earl F. Glynn has created an easy to use [list of colors](http://research.stowers-institute.org/efg/R/Color/Chart/ColorChart.pdf) is PDF format.
Other Options
The boxplot.matrix() function in the sfsmisc package draws a boxplot for each column (row) in a matrix.
The boxplot.n() function in the gplots package annotates each boxplot with its sample size.
The ** bplot()** function in the Rlab package offers many more options controlling the positioning and labeling of boxes in the output.
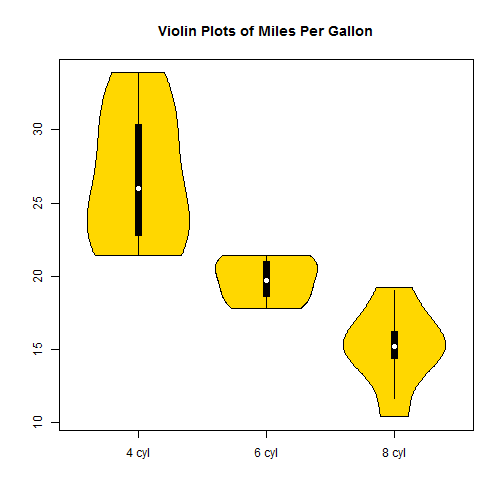
Violin Plots
A violin plot is a combination of a boxplot and a kernel density plot. They can be created using the vioplot() function from vioplot package.
library(vioplot)
x1 <- mtcars$mpg[mtcars$cyl == 4]
x2 <- mtcars$mpg[mtcars$cyl == 6]
x3 <- mtcars$mpg[mtcars$cyl == 8]
vioplot(x1, x2, x3, names = c("4 cyl", "6 cyl", "8 cyl"), col = "gold")
title("Violin Plots of Miles Per Gallon")
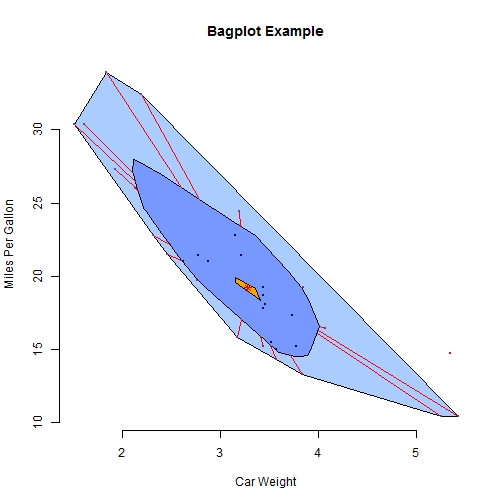
Bagplot - A 2D Boxplot Extension
library(aplpack)
attach(mtcars)
bagplot(wt, mpg, xlab = "Car Weight", ylab = "Miles Per Gallon", main = "Bagplot Example")