1 download data
library(FinCal)
library(reshape2)

dat <- get.ohlc.yahoo('AAPL', '2015-12-01', '2015-12-31')
#dat$date <- strptime(dat$date, "%Y-%m-%d")
dat$date <- as.Date(dat$date, "%Y-%m-%d")
dat$times <- seq(nrow(dat))
mm <- melt(subset(dat, select=c(times,adjusted, volume)), id.var="times")
2 lattice package
library(lattice)
xyplot(value~times|variable,data=mm,type="l",
       scales=list(y=list(relation="free")),
       layout=c(1,2))

3 ggplot2 package
library(ggplot2)
ggplot(mm, aes(x = times, y = value)) + geom_line(aes(color = variable)) +
      facet_grid(variable ~ ., scales = "free_y") + theme(legend.position = "none")

4 two different plots
p1 <- ggplot(dat, aes(date, adjusted)) + geom_line() + theme_minimal() +
      theme(axis.title.x = element_blank(), axis.text.x = element_blank())
p2 <- ggplot(dat,aes(date, volume)) + geom_bar(stat="identity") + theme_minimal() +
      theme(axis.title.x = element_blank(),axis.text.x = element_text(angle=90))
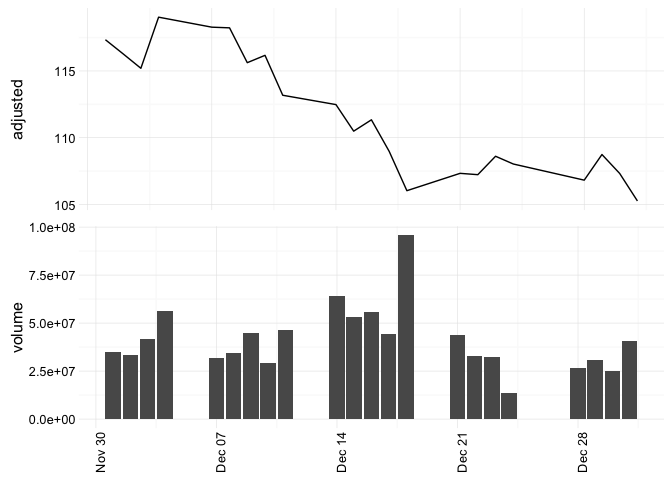
4.1 same widths, same heights
library(grid)
grid.newpage()
grid.draw(rbind(ggplotGrob(p1), ggplotGrob(p2), size = "last"))
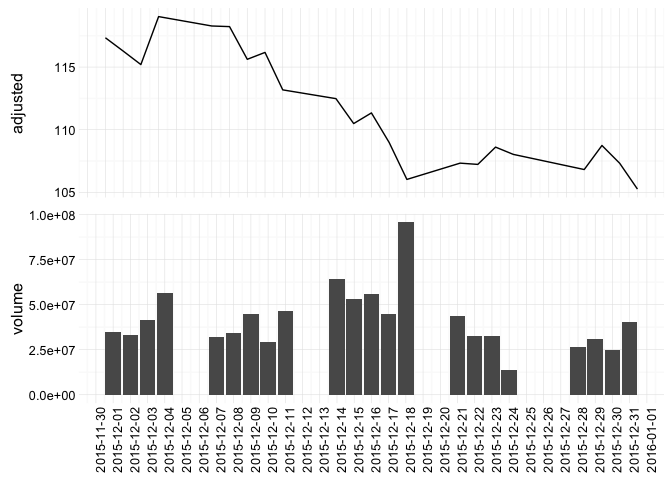
p3 <- p1 + scale_x_date(date_breaks = "1 day")
p4 <- p2 + scale_x_date(date_breaks = "1 day")
grid.newpage()
grid.draw(rbind(ggplotGrob(p3), ggplotGrob(p4), size = "last"))
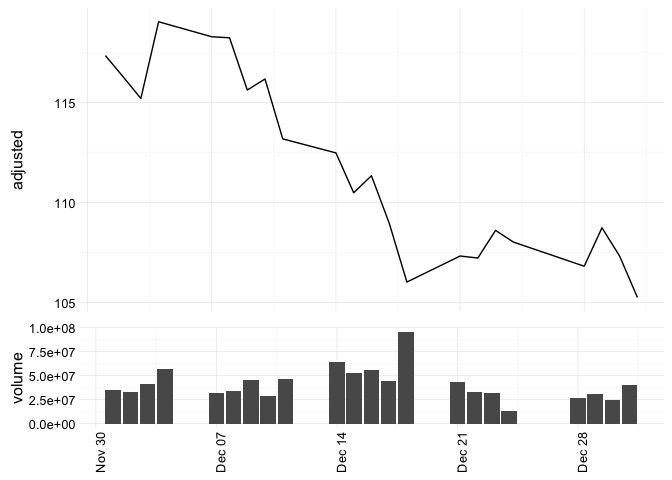
4.2 different heights, different widths
require(gridExtra)
grid.arrange(p1, p2, ncol = 1, heights = c(2, 1))

4.3 different heights, same widths
gb1 <- ggplot_build(p1)
gb2 <- ggplot_build(p2)
n1 <- length(gb1$panel$ranges[[1]]$y.labels)
n2 <- length(gb2$panel$ranges[[1]]$y.labels)
gA <- ggplot_gtable(gb1)
gB <- ggplot_gtable(gb2)
g <- gtable:::rbind_gtable(gA, gB, "last")
panels <- g$layout$t[grep("panel", g$layout$name)]
g$heights[panels] <- list(unit(n1*5, "null"), unit(n2,"null")) # change 5 to other int
grid.newpage()
grid.draw(g)
Reference
-
http://stackoverflow.com/questions/11794436/stacking-multiple-plots-vertically-with-the-same-x-axis-but-different-y-axes-in
-
https://gist.github.com/tomhopper/faa24797bb44addeba79
-
http://stackoverflow.com/questions/30308658/arrange-multiple-ggplots-with-same-plot-width-but-different-plot-height