boxplot
Ozone Solar.R Wind Temp Month Day
1    41     190  7.4   67     5   1
2    36     118  8.0   72     5   2
3    12     149 12.6   74     5   3
4    18     313 11.5   62     5   4
5    NA      NA 14.3   56     5   5
6    28      NA 14.9   66     5   6
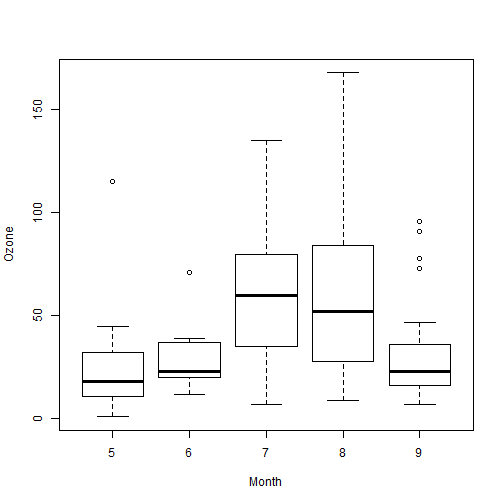
boxplot(Ozone ~ Month, data = airquality, xlab = "Month", ylab = "Ozone")
Ozone = airquality$Ozone
Month = airquality$Month
mymedians = tapply(Ozone, Month, median, na.rm = T)
mms = sort(mymedians)
temp = names(mms)
names(temp) = 1:length(temp)
st = sort(temp)
plotOrder = as.integer(names(st))
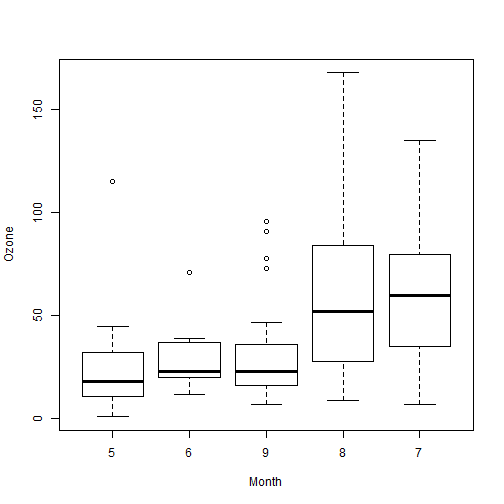
boxplot(Ozone ~ Month, at = plotOrder, xlab = "Month", ylab = "Ozone")
mylabels = vector()
for (i in 1:length(temp)) {
mylabels[i] = paste(temp[i], "(", mymedians[temp[i]], ")", sep = "")
}
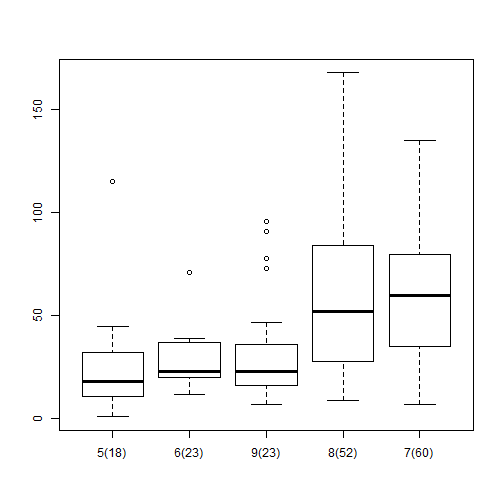
boxplot(Ozone ~ Month, at = plotOrder, xaxt = "n")
axis(side = 1, label = mylabels, at = 1:length(mylabels))