Generate data
library(ggplot2)
a <- seq(1, 20)
b <- a^0.25
df <- as.data.frame(cbind(a, b))
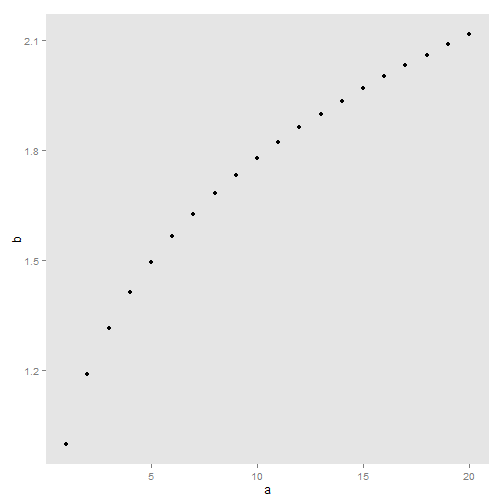
basic plot
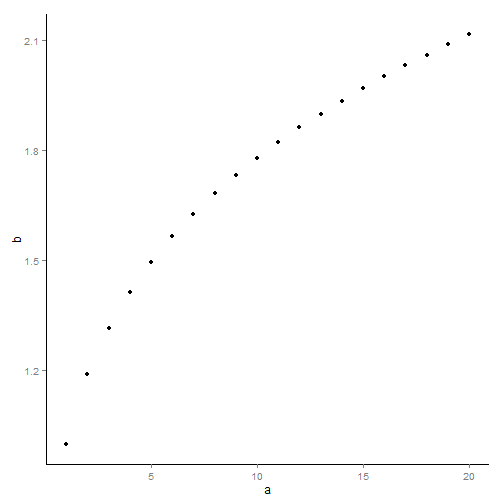
myplot = ggplot(df, aes(x = a, y = b)) + geom_point()
myplot

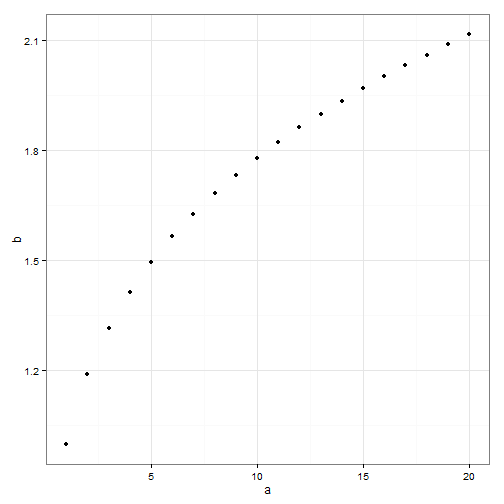
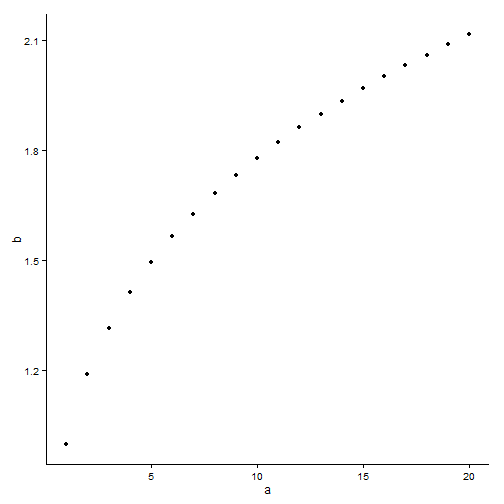
theme_bw() will get rid of the background
myplot + theme_bw()
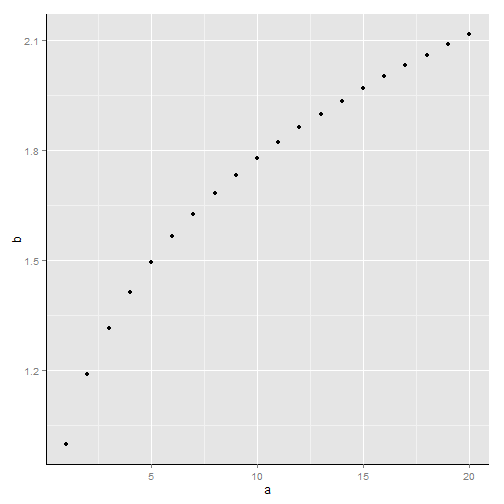
remove grid (does not remove backgroud colour and border lines)
myplot + theme(panel.grid.major = element_blank(), panel.grid.minor = element_blank())
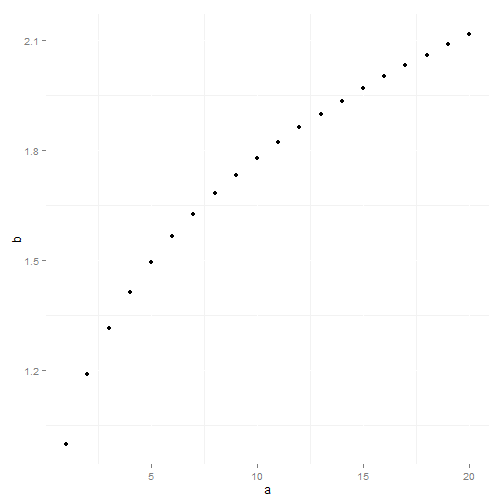
remove border lines (does not remove backgroud colour and grid lines)
myplot + theme(panel.border = element_blank())

remove background (remove backgroud colour and border lines, but does not remove grid lines)
myplot + theme(panel.background = element_blank())
add axis line
myplot + theme(axis.line = element_line(colour = "black"))
put all together - method 1
myplot + theme(panel.grid.major = element_blank(), panel.grid.minor = element_blank(),
panel.background = element_blank(), axis.line = element_line(colour = "black"))
put all together - method 2
myplot + theme_bw() + theme(panel.border = element_blank(), panel.grid.major = element_blank(),
panel.grid.minor = element_blank(), axis.line = element_line(colour = "black"))
Further reading
remove grid, background color and top and right borders from ggplot2