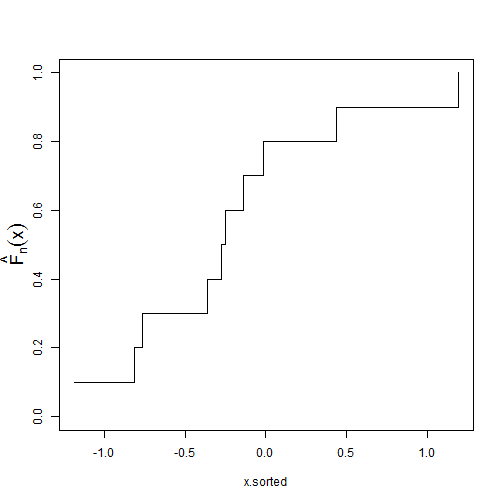
Method 1 Plotting the Cumulative Probabilities Against the Ordered Data
set.seed(9)
x <- rnorm(10)
n <- length(x)
x.sorted <- sort(x)
plot(x.sorted, 1:n/n, type = "s", ylim = c(0, 1), ylab = "")
# add the label on the y-axis
mtext(text = expression(hat(F)[n](x)), side = 2, line = 2, cex = 1.5)
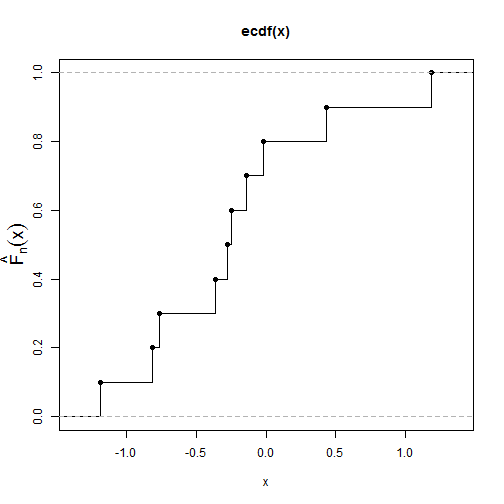
Method 2 Using the ecdf() and plot() functions
set.seed(9)
x <- rnorm(10)
plot(ecdf(x), ylim = c(0, 1), ylab = "", verticals = T)
# add the label on the y-axis
mtext(text = expression(hat(F)[n](x)), side = 2, line = 2, cex = 1.5)
Further reading
Exploratory Data Analysis: 2 Ways of Plotting Empirical Cumulative Distribution Functions in R
Plotting Two Empirical CDFs on the Same Graph